
(3200 words)
God give me strength to face a fact though it slay me.
Thomas Henry Huxley
Part 1 of this series can be found here: What is the carbon bubble?
Part 3 can be found here: How big would the bubble be, and who would get hurt if it pops?
In this second part of my three-part series on the carbon bubble, we dive into the reasons why some analysts believe it might be coming. At first blush, the idea of a fossil energy bubble might seem fanciful. While coal has been in decline over the past few decades in the US and the EU, it’s on the rise in Asia. Oil profits are still high. Saudi Aramco posted net revenue in 2018 of over $100 billion, making it the world’s most profitable company in that period, beating even Apple and other tech giants. Demand for liquid fuels remains strong and short term projections are that they will keep rising further. Those steady and bountiful profits over the decades have provoked animosity from those who pay dearly at the pump, but they made oil company stocks popular with investors. Could that be changing?
As I mentioned in Part 1, there are three possible causes for a shift: government policies to reduce fossil energy use; technological disruption that reduces demand; and shifts in social behavior, not only among environmentalists but also among those who allocate capital.
The Paris Agreement of 2015 sets concrete targets for total emissions of greenhouse gases, aimed at keeping global average temperatures within 2˚C of their pre-industrial levels, and it commits signatories to the pursuit of further efforts to limit that increase to 1.5˚C. These temperature targets, and the related emissions caps, lead to the concept of a ‘carbon budget’, the accumulated total amount of greenhouse gas emissions that humanity can ‘spend’ without going over the agreed limits. We’ve already ‘spent’ much of that ‘budget’, implying that from now on — if we aren’t going to blow our budget — the majority of the coal and oil already discovered will have to be 1] left in the ground, or 2] used in a way that emits no CO2 into the atmosphere, or that 3] we manage to develop ‘negative emissions’ technologies that work economically at industrial scales, enough to offset the ‘positive emissions’. In fact, it’s likely we’ll have to do some combination of all three.
But, technologies like CO2 capture and storage, which could make coal burning ‘clean’, or technologies that take CO2 directly out of the atmosphere (negative emissions), don’t currently exist at industrial scales. For an exhaustive summary of negative emissions technologies, see the recent National Academy report on the topic.
Even if the burning of fossil fuels can be made carbon neutral, we also have to take into account the fact that current mining methods have significant negative environmental impacts. Research into the development of ‘clean’ fossil fuel technologies, and the development of more benign mining methods, is certainly worth supporting. We can’t anticipate what kinds of discoveries and innovations might happen in coming decades. It’s entirely possible that one day we’ll learn how to pyrolyze coal or oil underground, with minimal environmental impact, and zero CO2 emissions. This possibility, in fact, is a good argument for leaving those resources underground now, so they will be available for future generations, after such technologies have been developed.
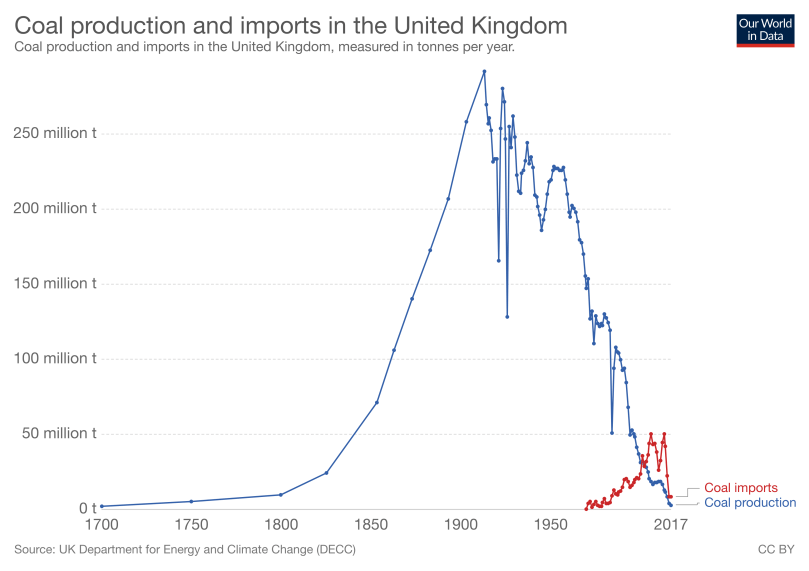
How fast can things change? Consider the plot below from Our World in Data, showing the historical use of coal in the United Kingdom. The UK, of course, was one of the homes of the Industrial Revolution, a place where coal mining formed a large part of the national identity until fairly recently. George Orwell’s book The Road to Wigan Pier provides a compelling look at that Welsh coal-mining world in the decades just before WWII. The up-ramp looks like classic exponential growth until the late 19th century when it slows, and then peaks. The approach to the peak in 1913 took about forty years for the last doubling, while first halving on the way down took until the early 1970s. If this pattern holds for fossil fuel usage in general, then it looks like we will be addicted to fossil energy sources for much of the 21st century, too. Is that the case?
Next consider the plot of global coal consumption, in unit of Terawatt-hours (TWh) of energy. The non-OECD countries in general, and China in particular, are now the major players after a long run in prior decades by the US and EU. This is why the majority of emissions up till now came from the developed world, but going forward the emissions will come largely from the developing world. It looks as though US and EU coal consumption has peaked. Perhaps even China’s has too, but it’s far too soon to be certain there. India is still on the rise. What’s striking for China, however, is the rapidity of the change. The last doubling prior to the recent peak took only ten years.
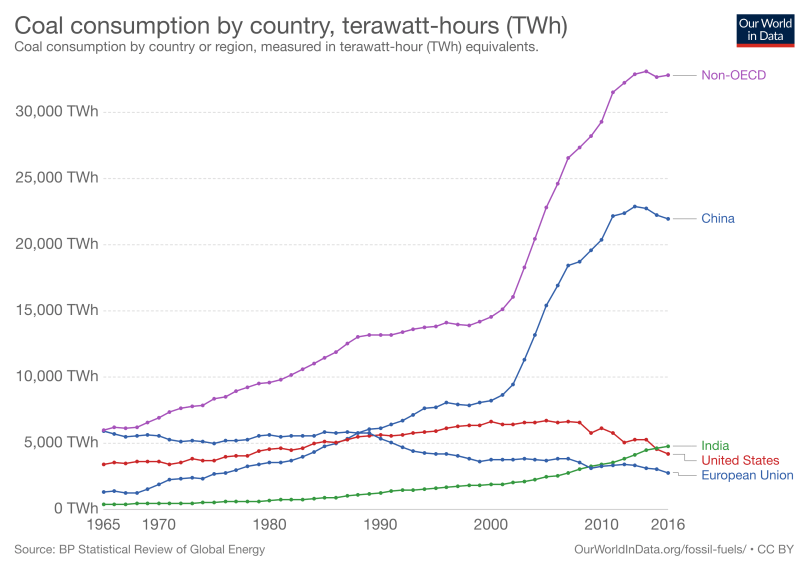
The large expansion in coal power in China in the late 20th century has been bad news for air quality there, and therefore China has now embarked on a rapid expansion of solar and other renewables. Can China ramp down coal consumption at the same rate they ramped up? Time will tell. But there are reasons to think the global transformation toward a lower-carbon economy will be more rapid than the UK experience with its transition away from coal. This is because we are now a global society, and we learn from one another. This is a cause for hope. The Chinese and the developing world don’t have to repeat the same mistakes, or cycle through the same generational sequence of technological change as the US and EU. They can hop forward to better technologies than the US and EU had at similar stages of economic development, if those technologies are on offer. Are they already here?
There are a lot of moving parts, and it can all be a bit overwhelming. But that’s why it’s important to know where to go for good information, and why it’s so valuable for researchers to develop tools the rest of us can use to understand that mountain of information. When the late Sir David MacKay joined the UK Office of Energy and Climate Change as Chief Science Advisor, he led the team that created the ‘Global Calculator‘. [1] This online tool allows anyone to explore the impact of different policy choices on the ability to hit global CO2 emissions and temperature targets, to inform public discussion around the difficult choices we all face in coming decades.
While the problem is complex, one thing is clear: ‘decarbonization’ of the world economy will not be cheap, though many studies suggest there will be offsetting gains that result from the adoption of new technologies, and actual savings realized by avoiding some of the worst downside future costs that might follow if we fail to act on climate now.
The shift will be wrenching because our entire civilization is based upon fossil fuels. We depend on them not only for fuels and electric power, but also food production, manufacturing, plastics, roads, building materials, and even beauty products. In Sustainable energy – without the hot air, MacKay carried out a kind of energy audit for the UK, and found that they could just barely transition to an economy based fully upon renewable energy and nuclear — provided they can import solar power via long-distance transmission lines from North Africa. When teaching a course a few years ago, I redid the estimates for the US, and came to a similar conclusion, though the numbers are of course very different. For example, our homegrown solar power potential is enormous compared to the UK.
Throughout the book, again and again, MacKay makes the case that the transition to a low-carbon world can’t be accomplished by working at the margins. Instead there must be a thoroughgoing overhaul of the energy economy, from stem to stern. Globally, some countries have lots of open spaces available for solar farms, or offshore wind, or geothermal sources, while others have high population densities, are too far from sunny regions, or are landlocked and relatively becalmed. Creative solutions will emerge, for example Singapore recently signed an agreement to buy power via a 3,700-kilometer undersea cable. This will provide about 20% of Singapore’s electricity, generated by what’s billed as the world’s largest solar-battery facility, in Australia. Not everyone will find it possible to switch to renewables generated domestically, and instead will have to buy that power from others. This is all within the realm of the possible technologically, but no country will find the transition easy, and some might find it politically impossible in the near term.
For example, the next plot shows the size of the reductions needed in oil production alone to meet the Paris Agreement emissions goals, as estimated by the International Energy Agency. We already saw this plot in Part 1.
This plot is the crux of the issue: the oil that will have to be left underground, the oil that forms the wedge between these two curves, has a current market value. Planning to leave it in the ground costs money for investors today. As mentioned in Part 1, the wedge represents over a hundred billion barrels of oil, with current market value of almost ten trillion dollars.
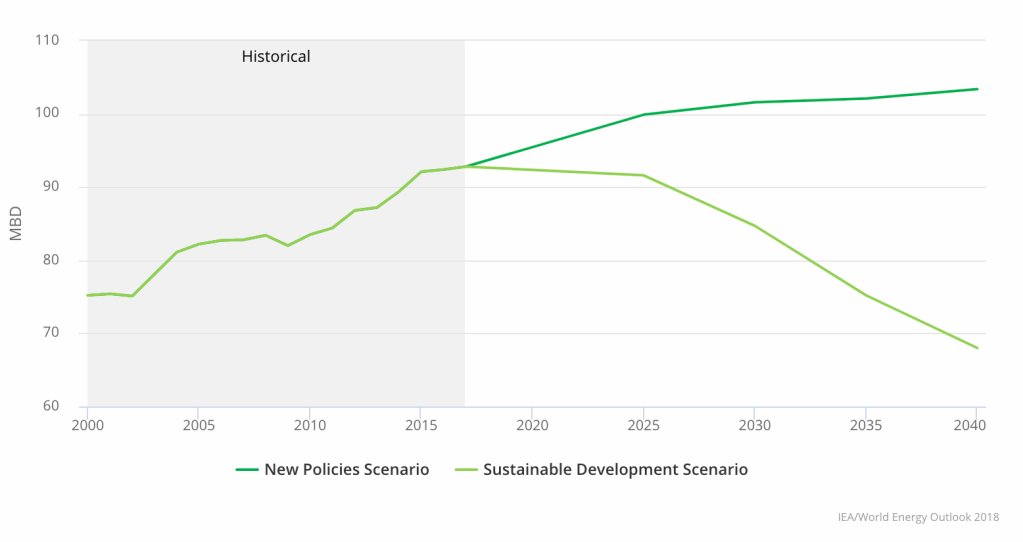
New Policies Scenario (NPS)
World Energy Outlook, 2018
Incorporates existing energy policies as well as an assessment of the results likely to stem from the implementation of announced policy intentions.
Sustainable Development Scenario (SDS)
Outlines an integrated approach to achieving internationally agreed objectives on climate change, air quality and universal access to modern energy.
But, there is an old saying in physics that the three laws of thermodynamics can be stated simply as: 1] you can’t win, 2] you can’t break even, and 3] you can’t get out of the game. In the same vein, with regard to energy economics, it isn’t a question of whether we can avoid paying costs associated with making our civilization more resilient to climate change, because some of those costs are unavoidable. We will always need to build schools and hospitals, roads, airports, transportation and power distribution systems. All that investment and expense will run into the tens of trillions of dollars in coming decades. We will have to pay large sums anyway, so we shouldn’t blanche when we hear big numbers associated with a transition to a low-carbon economy. We should accept that we’re going to have to pay, and instead focus on the question: What do we want to pay for?
Such a dramatic overhaul of our global economy seems daunting, perhaps overwhelming, but in fact we’ve reinvented civilization before, about once every generation or two. There is precedent for rapid transformations of our energy economy and transportation systems. In historical terms, we ‘carbonized’ quickly in the 19th century, with coal first, followed by oil toward the end of that century. In her wonderful 2007 book Oil on the brain, Lisa Margonelli recounts how the switch from coal to oil for transportation took off when a collection of technologies and social innovations combined to create the modern oil refining industry, the assembly-line form of car production, national highway systems, gasoline and fuel distribution networks, etc.
At the start of the 20th century, in the US an intrepid cross-country auto traveler needed to do most of their own repairs, hazard dangerous and poorly-maintained roads, and carry lots of gasoline on board because fill-ups were only available at refineries. Within a generation, there was a network of tens of thousands of service stations that dispensed gasoline and service at roadside. Thus the creation of the US car culture, and the open road mystique that came with it, happened in a few short decades.
The International Energy Agency expresses concern that the transition to a low-carbon economy is not moving fast enough, and they forecast an oil supply gap in the early 2020s as a result. But some analysts are more hopeful about the pace of change, that fossil fuel demand might slacken as well as supply, even as the world economy continues to expand, taking us along that path toward a lower-carbon future.
For example, consider the following chart from the International Renewable Energy Agency (IRENA) report Rethinking Energy: 2017. Many analysts believe studies like this provide evidence the transition to low-carbon power may be about to accelerate. A more recent report from IRENA includes projections out to 2022, showing the cost of renewables continuing to decline as measured by current contracts for new projects just getting underway.
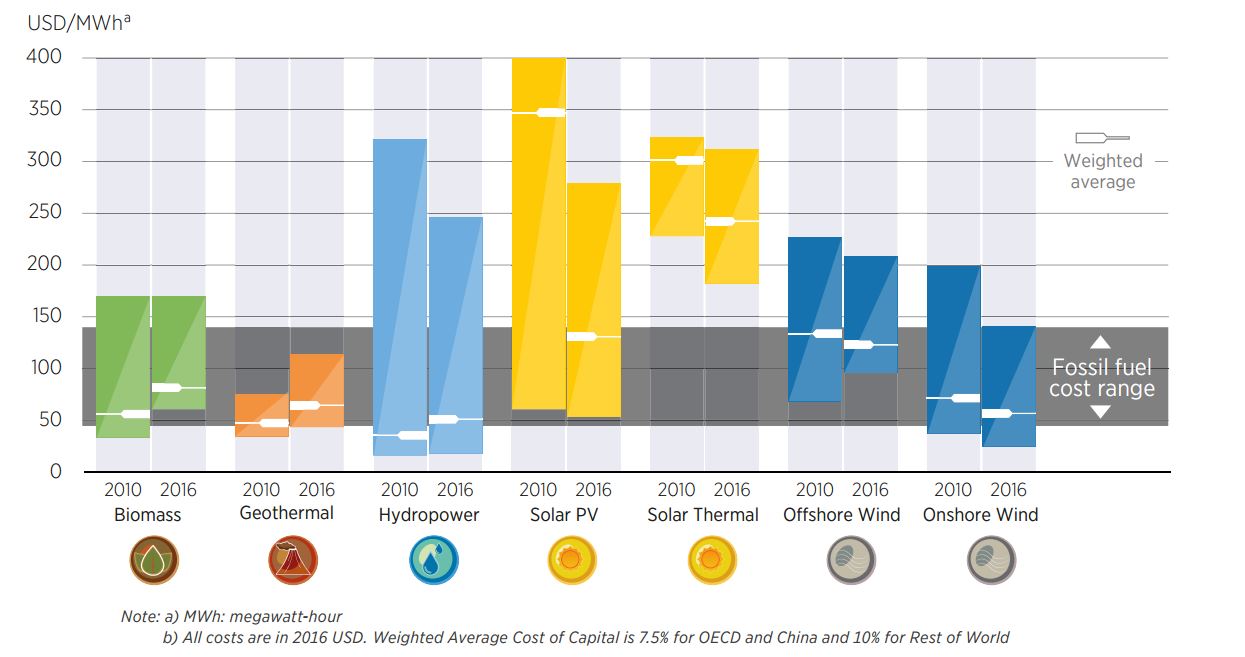
Source: IRENA Rethinking Energy: 2017.
The chart compares what is called the ‘levelized cost of energy’ (LCOE) in 2010 and 2016, for different sources of power. This method of comparing costs of power sources are preferred by analysts, because coal and natural gas plants have very different costs over their life cycle from solar or wind, with the latter requiring large upfront capital investments to build, but then much smaller ongoing operating costs. Meanwhile operating a fossil energy plant always requires fuel, a large lifetime cost. The LCOE estimates the average cost of power produced by the plant over its entire life-cycle. Like IRENA, Lazard, an investment firm, estimated in 2018 that the ‘ (LCOE) for solar and onshore wind are now directly competitive with coal and even natural gas, and they are still going down. Already, coal and some natural gas plants are shutting down early because they are no longer profitable.
Analysts like Ramez Naam of Singularity University, Tony Seba, or those at think tanks like the Carbon Tracker Initiative, Energy Innovation, and the Transition Pathway Initiative at the London School of Economics, believe we might be at a ‘tipping point’ for electric power generation. Consider the historical chart below, which shows the relative fraction of different power sources. Note that we currently get very little power from oil. Energy analysts believe that a large shift toward renewable energy as a source for electric power will most likely take market share away from coal, nuclear, and natural gas.
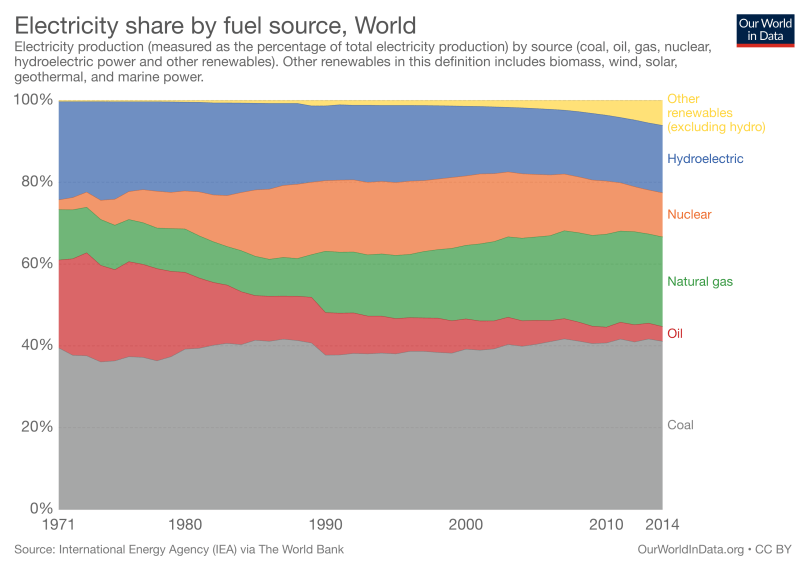
Although the overall mix of power generation is still dominated by fossil fuels, renewables are becoming a larger and larger fraction of the newly installed power plants. If the solar and wind power cost projections are correct, and we imagine redoing a plot like the one above in 2030, we might see that thin yellow sliver of renewables at the top — which looks so small now — in fact is simply the tip of a rapidly expanding wedge.
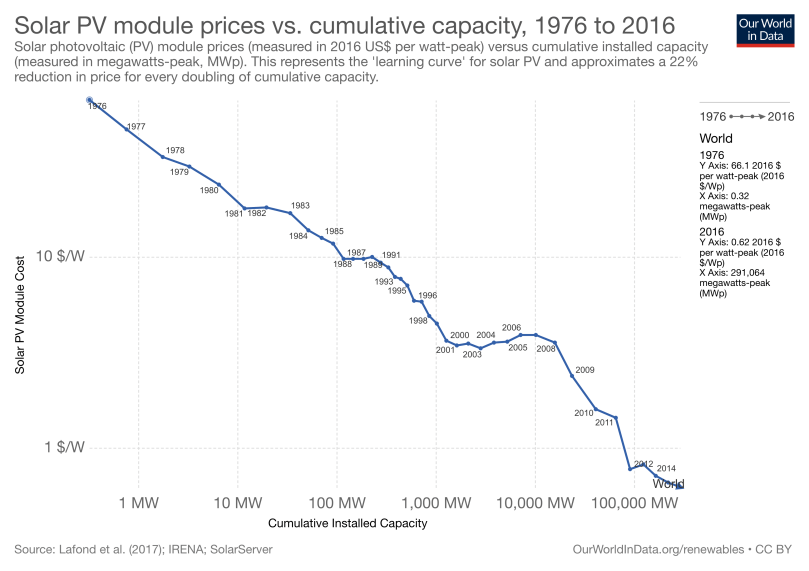
Why this might be the case can be seen in the plot below, which shows the downward trend in prices for solar PV over forty years. This is a log-log plot of the cost per Watt of power generated vs. the cumulative installed capacity (in megawatts). This shows dramatically how economies of scale have kicked in, especially in the last decade. Moving from 10,000 MW to 100,000 MW resulted in a factor of ten in cost reduction. This is remarkable, and game changing. Knowledge and manufacturing experience, along with the creation of the necessary legions of skilled technicians to install and maintain the facilities, leads to improvements in efficiency, and cost reductions. While solar PV is a maturing technology, is has probably not yet fully matured, and many analysts expect to see further reductions in cost. We don’t yet know where the bottom is in solar PV prices.
The transition away from fossil fuels is therefore underway because in many energy markets wind and solar energy are now directly competitive with fossil fuel sources, and their prices are still falling. If that trend continues, it will be cheaper to shut down an existing coal-fired power plant and replace it with renewable sources instead of waiting for the coal plant to age out. There will be no good reason to build new fossil plants when cheaper alternatives are available. This part of the story has little to do with the Paris Agreement, and everything to do with technological innovations that have been under development for two generations, now finally achieving economies of scale.
What about critics who point out the variability of renewable sources? Here storage technologies are advancing quickly, another game changer. For example, battery prices are dropping, with massive new ‘giga-factories’ planned worldwide. The largest battery facility in the world was recently installed in San Diego, with 250MW capacity it will be able to provide power for several hours during the early evening demand peak. In the next decade, more battery storage will become available at the same time that the price of electric vehicles will become directly competitive against fossil-fuel-powered cars and trucks. The power grid will have to be rebuilt and upgraded in that same time frame, to adapt to this new style of power generation and use.
These transitions, the upgrades and rebuilding of infrastructure, will cost trillions of dollars, and investments of that scale can make the heart quail and the knees go wobbly. But this time, unlike a generation past, we need to resist that instinctive blanch, and have the courage and vision to move in a new direction. We always have to keep in mind that we will have to spend those trillions anyway. Once a generation, all roads get repaved, all buildings get renovated. The power grid has to be overhauled, upgraded and modernized anyway. So now’s the time to do it better and smarter, planning for the necessary changes to allow for more renewable and lower-carbon technologies, and designing for a more nimble and robust response in the event of failures and natural disasters.
That nimbleness lies partly in the financial markets, as we discuss in Part 3.
Part 1: What is the carbon bubble?
Part 2: Why might it happen? [current post]
Part 3: How big would the bubble be, and who would get hurt if it pops?
[1] The Global Calculator was a project undertaken by the UK Department of Energy and Climate Change when Sir David MacKay was the Chief Science Advisor. Since his death, it has not yet found a permanent home, and some of the links have gone stale, but you can still run pre-set scenarios, create your own scenarios, and even download the original Excel spreadsheets for a deeper dive. Here’s the description from the UK DECC website: “The Global Calculator is an open-source model of the world’s energy, land and food systems that allows you to design your own version of the future up to 2050 and see the implications for the climate. The Global Calculator is a joint project between the UK’s Department of Energy and Climate Change, Climate-KIC, the World Resources Institute, Energy Research Institute of the National Development and Reform Commission and Energy R&D International (China), E&Y (India), the London School of Economics, Imperial College London, Climact the Climate Media Factory, and the International Energy Agency.”

The text is licensed under a Creative Commons Attribution-NoDerivatives 4.0 International License.

2 comments